Azure Monitor is an all-encompassing monitoring solution that empowers you to gather, analyze, and take action based on monitoring data from your cloud and on-premises environments. It can help you to enhance the availability and performance of your applications and services by providing you with profound insights into their performance.
Azure Monitor: An Overview
Azure Monitor gathers and consolidates data from all layers and components of your system, spanning across various Azure and non-Azure subscriptions and tenants. This data is stored in a unified platform, accessible to a suite of tools that can correlate, analyze, visualize, and respond to the information. This seamless integration extends to both Microsoft and non-Microsoft tools, promoting effortless interoperability.
High-Level Architecture
Azure Monitor is a versatile tool that enables monitoring of a wide range of resources, whether they reside in Azure, other cloud environments, or on-premises.
- Applications
- Virtual machines
- Guest operating systems
- Containers including Prometheus metrics
- Databases
- Security events in combination with Azure Sentinel
- Networking events and health in combination with Network Watcher
- Custom sources that use the APIs to get data into Azure Monitor
Additionally, you have the flexibility to export monitoring data from Azure Monitor to seamlessly integrate with third-party and open-source monitoring and visualization tools. This integration also extends to ticketing and other ITSM systems, allowing for a more streamlined and efficient workflow.
Azure Monitor now offers a powerful addition for System Center Operations Manager (SCOM) users - Azure Monitor SCOM Managed Instance (SCOM MI). This cloud-based version of Operations Manager allows you to seamlessly migrate your on-premises installation to Azure, unlocking a host of benefits.

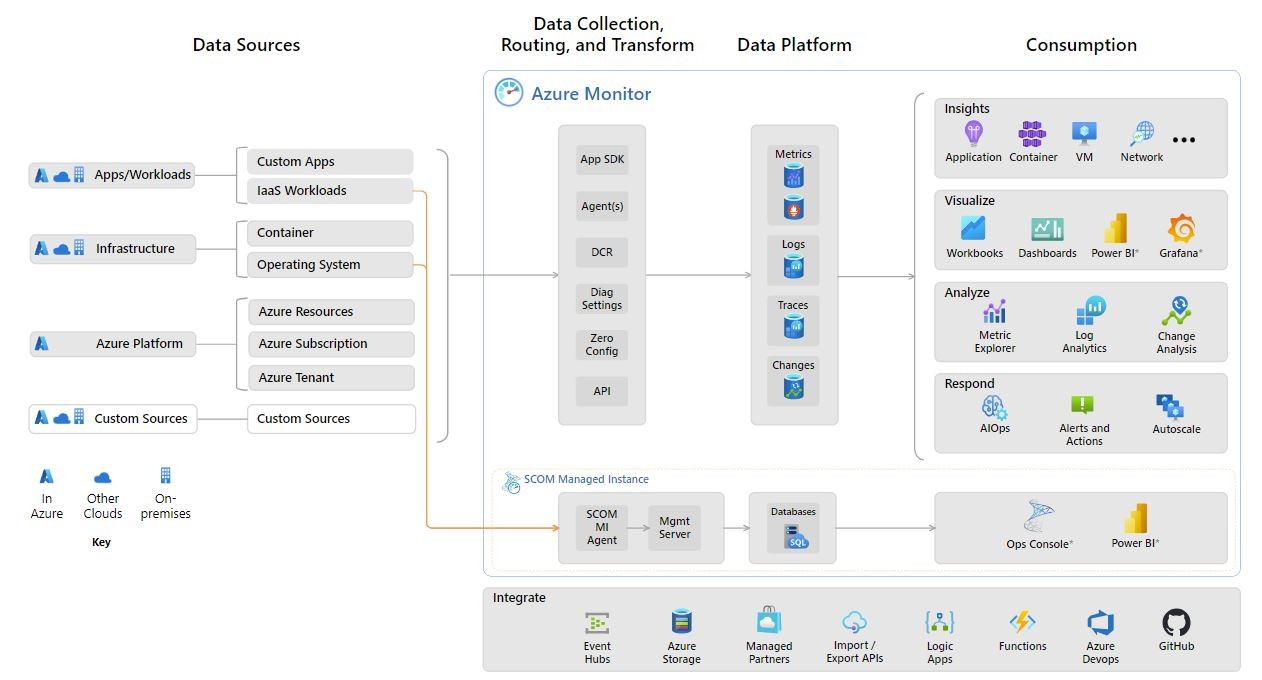
The diagram above provides a comprehensive architectural overview of Azure Monitor. On the left, various data sources transmit data to a centralized data platform, while on the right, Azure Monitor encompasses a range of features that leverage the accumulated data. This representation offers a high-level perspective on the interplay between data sources, the central platform, and the functionalities of Azure Monitor.
Data Sources
Azure Monitor has the capability to gather data from a diverse range of sources. This encompasses monitoring data from applications, infrastructure, and custom data sources, even those external to Azure, such as on-premises environments and non-Microsoft clouds. Let's explore the various types of data that Azure Monitor effectively collects:
- App/Workloads: Data on application performance, health, and activity.
- Infrastructure: Data about containers, such as Azure Kubernetes Service, Prometheus, and the applications running inside containers.
- Azure Platform: Data about the operation of an Azure resource from inside the resource, including changes.
- Custom Sources: Data that gets into the system using the Azure Monitor REST API or Data Collection API.

The above diagram depicts an expanded representation of the data source types collected by Azure Monitor.
Data Collection and Routing
Azure Monitor utilizes different mechanisms to collect and route data, tailored to the specific data and destination. These mechanisms include:
- Application instrumentation: This is enabled through either Auto-Instrumentation (agent) or by adding the Application Insights SDK to your application code.
- Agents: They can collect monitoring data from the guest operating system of Azure and hybrid virtual machines.
- Data collection rules: Use these to specify what data should be collected, how to transform it, and where to send it.
- Zero Config: Data is automatically sent to a destination without user configuration.
Data Platform
Azure Monitor utilizes four distinct data stores, each optimized for specific data types and monitoring scenarios. These include metrics, logs, distributed traces, and changes.
- Azure Monitor Metrics: Metrics are numerical values that describe an aspect of a system at a particular point in time.
- Azure Monitor Logs: Logs are recorded system events. They can contain different types of data, be structured or free-form text, and they contain a timestamp.
- Traces: Distributed tracing allows you to see the path of a request as it travels through different services and components.
- Changes: Changes are a series of events in your application and resources.
Data Analysis
Azure Monitor offers a variety of approaches for analyzing the gathered data, empowering you to delve deeper into valuable insights.
- Metrics Explorer You can utilize various configuration options to plot the values of Azure Monitor Metrics over time. This empowers you to track and analyze data with precision and flexibility.
- Log Analytics Utilizes the Kusto Query Language (KQL) to conduct in-depth analysis of log data. With this powerful tool, you can effortlessly craft intricate queries, leverage machine learning functions, and seamlessly integrate data from diverse sources.
- Application Insights Analytics An alternative implementation of Log Analytics, designed specifically for handling Application Insights data.
- Azure Monitor Workbooks These offer a versatile platform for data analysis and the creation of visually stunning reports right within the Azure portal. They empower you to seamlessly integrate multiple data sources from across Azure, resulting in unified and interactive experiences that are both insightful and engaging.
Visualization
Leveraging visualizations of monitoring data can provide valuable insights into the performance and health of your resources. Azure Monitor offers several effective methods to accomplish this.
- Dashboards Azure Dashboards enable you to seamlessly merge diverse data types into a unified view within the Azure portal.
- Views Azure Monitor Logs offers customized log data presentations called Views, which are created using KQL queries. These Views allow for tailored analysis and insights, enhancing the overall experience of working with log data in Azure Monitor.
- Workbooks Workbooks seamlessly integrate text, analytics queries, metrics, and parameters to create immersive and interactive reports that deliver a wealth of insights.
- Power BI Power BI is a powerful tool that allows for the visualization of log data and seamless sharing of the insights through interactive dashboards.
Alerts and Automated Actions
Azure Monitor excels at identifying potential issues with your applications and other resources, allowing for proactive measures. By leveraging Alert Rules, you can define specific conditions that trigger Action Groups to automate necessary actions. This streamlined approach ensures prompt resolution and enhances the overall efficiency of your system.
- Alerts Proactive alerts will promptly notify you of any issues with your infrastructure or application via email or SMS messages.
- Autoscale Autoscale empowers you to optimize service performance and resource utilization effortlessly. It automatically adjusts the number of running instances based on demand or a predefined schedule, ensuring seamless scalability.
- Logic Apps/Runbooks Process automation utilizes these tools. When an alert is triggered, it initiates an Azure Logic App or Runbook to promptly take corrective action.
Integration
Azure Monitor offers flexible options for directing data to various destinations, enabling comprehensive analysis, visualization, integration with other systems, and long-term archiving.

- Event Hubs: Azure Event Hubs serves as a platform for event ingestion and streaming. It has the capacity to modify and store data utilizing any real-time analytics provider or batching/storage adapters. You can employ Event Hubs to channel Azure Monitor data towards SIEM and monitoring tools of your choice.
- Azure Storage: Export data to Azure storage for less expensive, long-term archival of monitoring data for auditing or compliance purposes.
- Hosted & Managed Partners: Many external partners integrate with Azure Monitor. Azure Monitor has partnered with other monitoring providers to provide an Azure-hosted version of their products to make interoperability easier. Examples include Elastic, Datadog, Logz.io, and Dynatrace.
- API: Multiple APIs are available to read and write metrics and logs to and from Azure Monitor in addition to accessing generated alerts. You can also configure and retrieve alerts. With APIs, you have unlimited possibilities to build custom solutions that integrate with Azure Monitor.
- Azure Logic Apps: Azure Logic Apps is a service you can use to automate tasks and business processes by using workflows that integrate with different systems and services with little or no code. Activities are available that read and write metrics and logs in Azure Monitor. You can use Logic Apps to customize responses and perform other actions in response to Azure Monitor alerts. You can also perform other more complex actions when the Azure Monitor infrastructure doesn't already supply a built-it method.
- Azure Functions: Similar to Azure Logic Apps, Azure Functions give you the ability to preprocess and post process monitoring data and perform complex action beyond the scope of typical Azure Monitor alerts. Azure Functions uses code however providing additional flexibility over Logic Apps.
- Azure DevOps & GitHub: Azure Monitor Application Insights gives you the ability to create Work Item Integration with monitoring data embedding in it. Additional options include release annotations and continuous monitoring.
The Wrap Up
Azure Monitor is like a powerful tool that keeps an eye on everything - applications, infrastructure, and networks. It's like having a special power to collect, analyze, visualize, and connect data, giving you super insights into the performance and health of your system. With these insights, you can troubleshoot issues like a pro, keep your system running smoothly, and make smart decisions about scaling and optimizing your applications and services. Whether you're a developer looking to dive deep into your apps or an IT whiz in charge of keeping things in check, Azure Monitor gives you all the tools you need to rock it.

